

Please note that a dedicated Quick Start Guide Limits and Notifications is available to help you get started quickly.

We continuously improve our web application and connected devices to enhance usability, data reliability, and workflow efficiency. Below you will find a structured overview of recent feature releases, system improvements, and performance updates.
If you have any specific questions, please feel free to reach out to us via our contact form.
We have introduced two new warning indicators in the PREMO charts to help users interpret sensor data more effectively and identify potential issues early.
.png?width=1361&height=649&name=Bild%20(4).png)
High Pressure Warning (yellow)
Appears when measured pressure exceeds 200 kPa
Indicates that values above this threshold may be less accurate
Helps protect sensors from unnecessary stress or damage
Reminds users that hardened concrete pressure may no longer reflect actual formwork load
Bad Measurement Warning (red)
Displayed when no valid measurement data is received from the sensor
Helps users quickly detect communication issues, connection problems, or sensor malfunctions
Allows early action before important monitoring data is lost
Built-in Troubleshooting Support
Both warnings are directly linked to dedicated troubleshooting guides. Simply click on the warning icon or message in the chart to access a step-by-step guide with possible causes and recommended actions.
Please note: Warning indicators are visible in the chart view only and are not included in generated reports.
We're excited to announce a significant enhancement to the Mapping Sensor Locations feature in the WebApp — giving users greater flexibility when visualizing sensor positions and measurement data across complex monitoring projects.
What's New:
Multiple images per widget — document different areas, floors, or construction phases within one centralized view
Flexible image layouts — arrange images in single or two-column layouts across multiple rows for a clear, structured overview
Reuse sensors across images — display the same sensor in an overall site view, a detail image, and a specific project section simultaneously
Simplified sensor labels — labels now show only the sensor name and latest measurement value for a cleaner visualization
Additional details on hover — access sensor serial number and measurement timestamp without cluttering the main view
Please note: The Mapping Sensor Locations feature is currently available in the WebApp widget only and is not yet included in generated reports or printouts.
We're excited to announce that a new firmware version for the SONO Hub is now available — bringing new features, stability improvements, and bug fixes.
New Features:
More detailed event logging for better traceability
Support for automatic and manual time events
W/C values can now be displayed with two or three decimal places (device display)
Improvements:
Smoother battery indication with a low-pass filtered battery curve
Loading spinner when communicating with the probe prevents the interface from appearing frozen
Improved manual time-setting menu for better usability and clarity
We recommend updating all devices to benefit from these enhancements.
Due to current supply constraints for the standard 100 m roll, we have introduced two new packaging lengths for our temperature sensor cables.
Customers can now order temperature sensor cables in flexible lengths to better match their project requirements:
We’re excited to introduce a powerful new feature that brings sensor data into real-world context: Mapping Sensor Locations.
With this update, customers can now visualize their sensors directly on an image, construction plan, or photo—making it much easier to understand where measurements are taken and how they relate to the actual project.
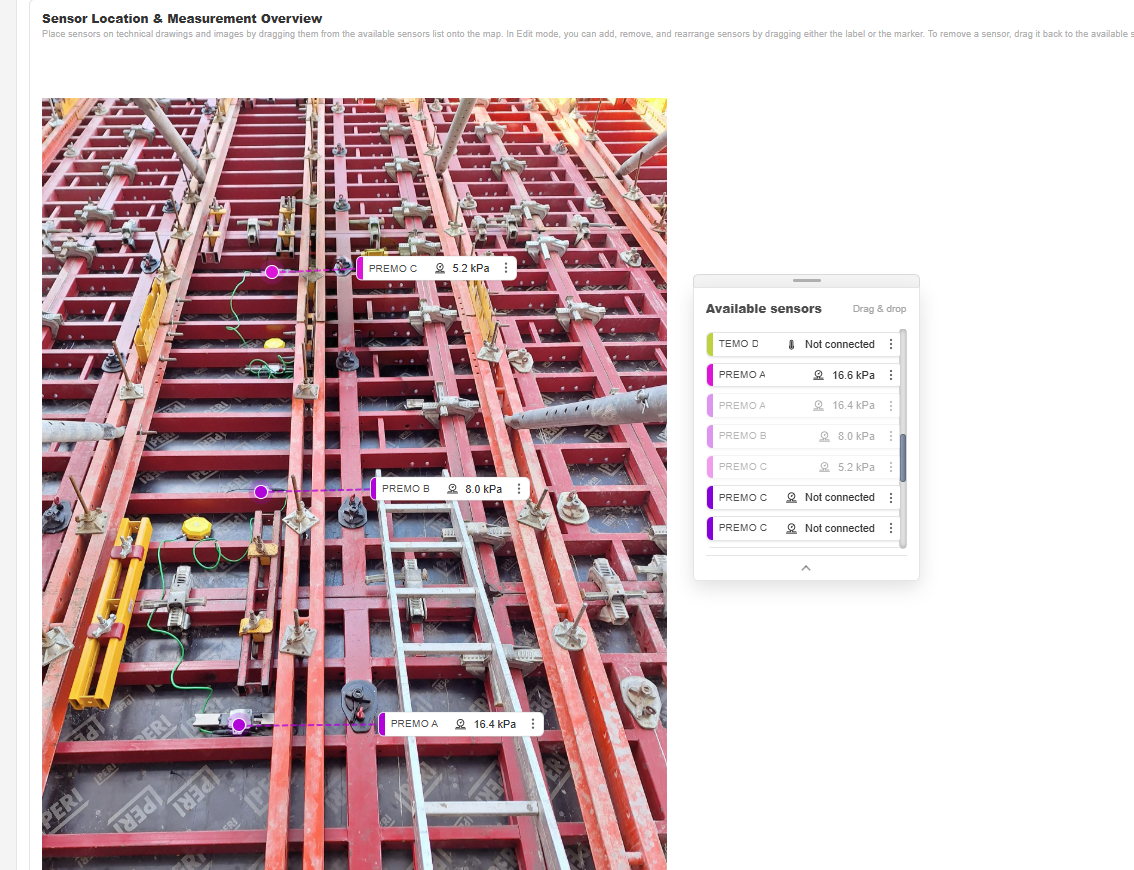
How it works
Customer Benefits:
A new firmware version for ISC Link and TEMO Link devices has been released.
With this update, TEMO and PREMO sensors connected to an ISC Link device can now record measurements simultaneously.
This enables:
Simultaneous logging of TEMO and PREMO measurements
Automatic upload of both measurement datasets to the platform
More complete monitoring setups when multiple sensors are used
These improvements help ensure that all relevant measurement data is captured and available for analysis within the platform.
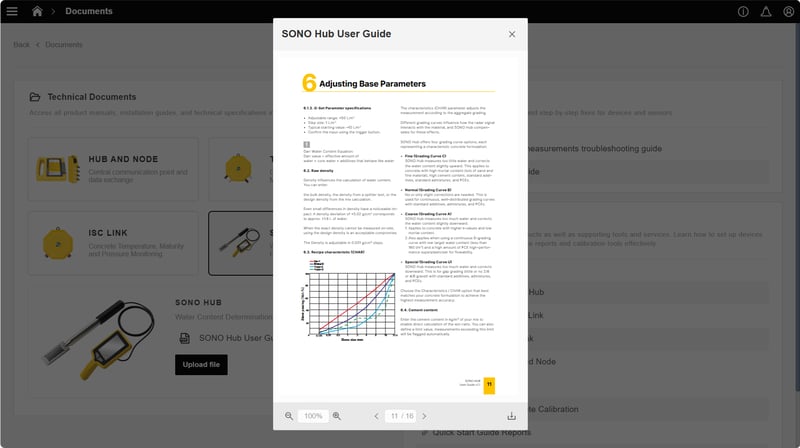
Manuals in the Support → Technical Documents section can now be viewed directly as PDFs within the browser.
This means documentation can be accessed immediately without downloading files first.
Benefits include:
Faster access to manuals and technical documentation
No additional download step required
Improved usability across desktop and mobile devices
Documents and images can now be attached directly to widgets in the web application.
This allows you to store measurement data together with all relevant supporting documentation in one central place.
Key capabilities include:
Upload documents such as plans, delivery notes, or reports
Add photos of monitored objects or installed sensors
Store up to two files per measurement series directly within the widget
This improves project documentation, ensures better traceability, and provides full context for data analysis and reporting.
Dashboards can now contain measurements directly, without requiring a section structure.
This reduces setup time and makes configuration easier, especially for smaller projects or new users.
The export functionality has been extended:
Working with measurement data in Excel is now more straightforward and flexible.
Users can now create fully functional demo projects within the web application.
Demo projects:
This supports structured onboarding, clearer product demonstrations, and improved stakeholder engagement.
Users can now receive project notifications directly via WhatsApp.
This enables:
Notification settings can be managed individually in personal settings.
Please note that a dedicated Quick Start Guide Limits and Notifications is available to help you get started quickly.
To support North American operations, the system now supports:
This ensures clearer reporting and regional compatibility.
We have enhanced calculation and validation logic across devices and reports:
These updates improve data reliability and support more accurate decision-making.
Calibration certificates for PREMO pressure sensors can now be downloaded directly within the web application under the sensor configuration settings.
This provides:
(Available for PREMO pressure sensors using the latest firmware and compatible dashboards.)
Project settings, devices, and users are now directly visible within dashboards.
This update reduces navigation steps and improves overall workflow efficiency, especially during active project management.